


Market Update 03/11/2024
USING “CAPE” AS A MARKET BAROMETER
The long-term valuation of the market is commonly measured by the Cyclically Adjusted Price to Earnings ratio, or “CAPE”, which smooths-out shorter-term earnings swings in order to get a longer-term assessment of market valuation.
A CAPE level of 30 is considered to be the upper end of the normal range. Since 1881, the average annual return for all ten-year periods that began with a CAPE in this range has been slightly positive to slightly negative.
THE CAPE THIS YEAR (2024)
|
CAPE VALUE |
DATE |
% change WEEK |
% change ytd |
|
31.19 |
JAN 1, 2024 |
— |
— |
|
33.55 |
FEB 1, 2024 |
UP 7.6% |
UP 7.6% |
|
34.21 |
MARCH 1, 2024 |
UP 1.97% |
UP 9.7% |
|
34.31 |
MARCH 8, 2024 |
UP 0.29% |
UP 10.0% |
Note: We do not use CAPE as an official input into our methods. However, we think history serves as a guide and that it’s good to know where we are on the historic continuum.
THE BIG PICTURE:

Counting-up of the number of all our indicators that are ‘Up’ for U.S. Equities, the current tally is that all of the four are Positive. These represent a multitude of timeframes (two that can be solely days/weeks, or months+ at a time; another, a quarter at a time; and lastly, the {typically} years-long reading, that being the Cyclical Bull or Bear status).
- LONG-TERM CYCLICAL BULL/BEAR — POSITIVE since April 21, 2023
- MIDTERM/QUARTERLY — POSITIVE since January 1, 2024
- SHORT-TERM — POSITIVE since November 16, 2023
- SHORT-TERM — POSITIVE since November 21, 2023
IN THE MARKETS THE WEEK ENDING MARCH 8, 2024:
U.S. MARKETS:
With many hoping that the Federal Reserve might give stronger indications on their decision to cut interest rates sooner rather than later, we saw strong intraday moves in the market this week. The large-cap S&P 500 Index and mid-cap S&P 400 Index soared to new record intraday highs, joined by the Nasdaq Composite before a pull-back back late on Friday. While small-cap and value shares outperformed, mega-cap tech shares slowed, with part of the lag coming from a decline in Apple. This comes after reports that iPhone sales in China are slowing.
On Thursday, Tesla was displaced as the 12th biggest public company by market capitalization. The spot is now occupied by the Danish pharmaceuticals company Novo Nordisk, which has seen robust demand for its diabetes and weight loss drugs.
LOOKING AT THE INDEXES: It was a mixed week for the indexes, with the Dow, Nasdaq, and large-cap struggling to maintain its prior week’s gains. Small and mid-cap saw encouraging lifts.
|
INDEX |
FRIDAY’S CLOSE |
WEEK’S CHANGE |
% change ytd |
|
DJIA |
38,722.69 |
DOWN 364.69 |
+ 2.74% |
|
S&P 500 |
5,123.69 |
DOWN 13.39 |
+ 7.42% |
|
Nasdaq comp. |
16,085.11 |
DOWN 189.83 |
+ 7.15% |
|
s&P 400 (midcap) |
2,952.39 |
UP 41.73 |
+ 6.14% |
|
Rusell 2000 |
2,082.71 |
UP 6.32 |
+ 2.74% |
COMMODOTIES / FUTURES
The week was more balanced for commodities / futures, with oil holding mostly steady, and gold, silver & copper enjoying some increases.
GOLD (GC00) ended the week at $2,186.20 per ounce vs the prior week of $2,095.70. While steady last week, Gold boasted growth of 4.32% at market close this week.
SILVER (SI00) saw nice gains for the week, increasing to a close of $24.55 per ounce – a 5.05% lift over last weeks close of $23.37.
COPPER (HG00), saw a miniscule increase over the prior week. This commodity is sometimes viewed as a barometer of world economic health, and showed here to hold steady with slight increase, ending the week up 0.78% at $3.89 per pound vs the prior week of $3.86.
CRUDE OIL (CL-1) for April delivery ended the week at $78.01 per barrel, keeping most of its prior week’s gains and declining less than half a dollar.
The VIX closed at 14.74 this week, a 12.4% increase over last week’s close of 13.11. The Volatility Index or VIX is the annualized implied volatility of a hypothetical S&P 500 stock option with 30 days to expiration. The price of this option is based on the prices of near-term S&P 500 options traded on CBOE. It can help investors estimate how much the S&P 500 Index will fluctuate in the next 30 days. While the VIX only measures the volatility of the S&P 500 Index, it has become a benchmark for the U.S. stock market.
The VIX is often referred to as the market’s “fear index or fear gauge”. The performance of the VIX is inversely related to the S&P 500 – when the price of the VIX goes up, the price of the S&P 500 usually goes down. If the VIX is rising, demand for options is increasing, and therefore, becoming more expensive. If the VIX is falling, there's less demand, and options prices tend to fall. One thing to keep in mind is that current volatility cannot be known ahead of time. That's why it's a good idea to use the VIX in tandem with technical and fundamental analysis.
INTERNATIONAL MARKETS
|
GLOBAL EXCHANGE/index |
week CLOSE |
% change WEEK |
% change ytd |
|
CANADA - TSX |
21,737.53 |
UP 0.86% |
UP 4.15% |
|
UK – FTSE 100 |
7,659.74 |
DOWN 0.30% |
DOWN 0.80% |
|
FRANCE – CAC 40 |
8,028.01 |
UP 1.18% |
UP 6.60% |
|
GERMANY - DAX |
17,814.51 |
UP 0.45% |
UP 6.23% |
|
CHINA – SHANGHAI COMP. |
3,046.02 |
UP 0.63% |
UP 2.83% |
|
JAPAN – NIKKEI 225 |
39,688.94 |
DOWN 0.56% |
UP 19.23% |
The MSCI (Morgan Stanley Capital International) Emerging Markets Index grew by 1.21% for the week closing at 1037.09 vs the prior week of 1024.68, with a YTD growth of 1.21%.
U.S. ECONOMIC NEWS:
On Wednesday, the Fed reported in its periodic Beige Book survey of regional economic conditions that consumers were showing more sensitivity to rising prices, while the Labor Department said that job openings fell in January to their lowest level in three months.
The quits rate — the share of workers leaving jobs voluntarily, typically considered a good measure of workers’ perception of the ease of finding a new job — also fell to its lowest level since August 2020, early in the rebound from the pandemic. U.S. employers added 275,000 jobs in February, topping the 198,000 economists polled by The Wall Street Journal expected. The unemployment rate ticked up to 3.9%, while wage growth slowed. Recent strong readouts were revised downward.
Some analysts argued that the report shows the Federal Reserve can curb inflation without tipping the economy into a downturn. On Thursday, Fed Chair Jerome Powell stated that policymakers were “not far” from having the confidence that inflation’s downtrend will be sustained, enabling them to begin cutting rates. As a result, futures markets ended the week pricing in a somewhat higher (71.0%, according to the CME FedWatch Tool) chance of a cut at the Fed’s policy meeting by June.
Powell’s comments and the downside economic surprises helped push the yield on the benchmark 10-year U.S. Treasury note to its lowest intraday level (4.03%) since February 2. (Bond prices and yields move in opposite directions.) Tax-free municipal bonds lagged Treasuries over the week, bringing the relationship between muni and Treasury yields closer to historical averages. Yet primary issuance was relatively subdued, and the deals that reached the market were met with strong demand.
INTERNATIONAL MARKET & ECONOMIC NEWS
European Overview: In local currency terms, the pan-European STOXX Europe 600 Index gained ground for the seventh straight week, hitting a record high on the way to a 1.14% gain. Among the major stock indexes, Italy’s FTSE MIB gained 1.43%, France’s CAC 40 Index added 1.18%, and Germany’s DAX ticked up 0.45%. The UK’s FTSE 100 Index declined 0.30%. Ten-year government bond yields for Germany, Italy, and France declined after the European Central Bank (ECB) left its monetary policy unchanged and signaled that interest rates could be cut in June.
The central bank now sees inflation falling to 2.0% in 2025, rather than 2026. Projections for core inflation, which excludes volatile food and energy prices, were also revised lower, with the latest update suggesting that it would hit the 2.0% target in 2026. The ECB’s latest forecast cut economic growth to 0.6% in 2024, which was slightly lower. However, it expects growth to accelerate to 1.5% in 2025.
The UK rolls out another payroll tax cut under Chancellor of the Exchequer Jeremy Hunt, in his last Spring Budget before a general election. He unveiled a reduction in national insurance rates that would amount to a GBP 10 billion payroll tax cut which also included changes to child benefit rules that would make them more generous. The Office for Budget Responsibility said that spending cuts of GBP 20 billion were still required to balance the budget. It also said that taxes would climb to 37.1% of gross domestic product (GDP) by 2028–2029, a figure that was lower than the 37.7% predicted in November.
JAPAN: The performance of Japan’s stock markets was mixed over the week, with the Nikkei 225 Index finishing 0.56% lower and the broader TOPIX Index gaining 0.64%. Exuberance around artificial intelligence and solid corporate earnings boosted sentiment. The yield on the 10-year Japanese government bond rose to 0.73% from 0.71% at the end of the previous week. The yen appreciated sharply to around JPY 147.4 against the U.S. dollar from about 150.1 the prior week. The currency’s strength weighed on Japan’s exporters, as they derive a significant share of their revenues from overseas. Japanese stock markets have been significantly boosted by historic yen weakness over the past three years.
Household spending fell by 6.3% year on year in January, the sharpest decline in nearly three years. Weakness was evident across most categories and notably in auto sales. Inflationary pressure has had the effect of weighing on domestic demand. Conversely, nominal wage growth came in higher anticipated, with wages rising 2.0% year on year in January versus estimates of 1.2%. Japan’s unions are demanding the highest wage rises in over three decades at this year’s spring shunto negotiations. Finally, the consumer price index for the Tokyo area rose 2.5% year on year in February, in line with expectations.
CHINA: Chinese equities gained as the government’s recent market stabilization measures lifted investor confidence despite an uncertain economic outlook. The Shanghai Composite Index rose 0.63%, while the blue chip CSI 300 added 0.2%. In Hong Kong, the benchmark Hang Seng Index gave up 1.42%, according to FactSet.
Beijing set an economic growth target of around 5% this year at the National People Congress (NPC), China’s parliament, which started March 5 and ends March 11. The target was the same as last year, when China’s economy officially rose 5.2%. However, analysts said it would be hard to match last year’s growth pace, which benefited from a post-lockdown rebound in early 2023. The government set the budget deficit at around 3%—the same target as early last year until it was subsequently raised to 3.8% to accommodate more borrowing—and said it would issue RMB 1 trillion in special ultra-long central government bonds to support growth.
Chinese exports and imports rose in the first two months of the year. Exports grew an above-consensus 7.1% in January and February from the prior-year period, improving from December’s 2.3% increase. Imports rose 3.5% over the two-month period, greater than the 0.2% gain in December. China combines trade data for the first two months of the year to smooth out distortions arising from the weeklong Lunar New Year holiday.
HIGHLIGHT OF THE WEEK – THE 1% CLUB
By 2022, a total of 1.1% of the world’s adults were millionaires. That number was up 0.6% from the report pulled a decade earlier in 2012.
But how do you know if you’re part of the 1% in your country? This infographic from Visual Capitalist captures the net wealth required to enter the club in selected countries and territories. The data used is sourced from the Knight Frank Wealth Report 2024.
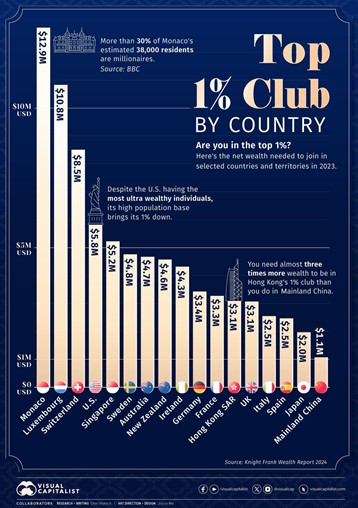
Joining this exclusive list has varying qualifications, depending on where you live. European hubs top the list, with small countries like Monaco or Luxembourg having extremely high wealth barriers to joining the top 1%.
According to the 2022 report, Monaco boasts the #1 position with a cool $12.9 million required to join their 1% club. That same report details that currently more than 30% of Monaco’s estimated 38,000 residents are millionaires.
Following closely in second is Luxembourg, with a $10.8 million entrance fee. Not a whole further back in third is Switzerland at $8.5 million for their countries one-percenters.
Not surprisingly, the U.S. takes fourth position at a ticket price of $5.8 million. Despite having the most ultra-wealthy individuals in the group, because of the high population base, the law of averages brings America down to #4.
In the Asia Pacific region, Singapore leads the pack. They hold a current requirement of $5.2 million, while Hong Kong comes second in their region at $3.1 million. It’s interesting to note that a person in Hong Kong needs almost three times more wealth to join the 1% club compared to someone in Mainland China.
Joining your region’s group often requires a combination of advanced education, entrepreneurship, strategic investments, and sometimes, even a bit of luck. There’s no guaranteed path to entry, but consistency in wealth growth and time are key factors.
Take for example the U.S. Most of the individuals and families who have made it past the 1% threshold have done so over time. It’s a marathon.
Sources: All index- and returns-data from Norgate Data and Commodity Systems Incorporated; news from Reuters, Barron’s, Wall St. Journal, Bloomberg.com, ft.com, guggenheimpartners.com, zerohedge.com, ritholtz.com, markit.com, financialpost.com, Eurostat, Statistics Canada, Yahoo! Finance, stocksandnews.com, marketwatch.com, visualcapitalist.com, wantchinatimes.com, BBC, 361capital.com, pensionpartners.com, cnbc.com, FactSet